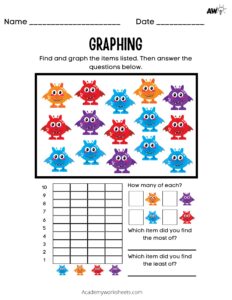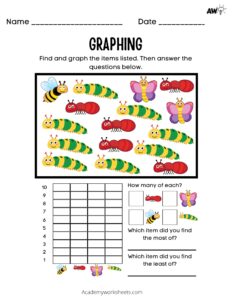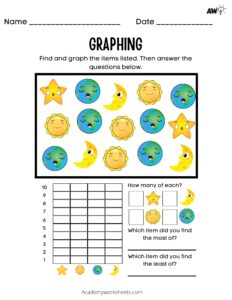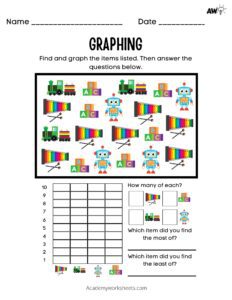
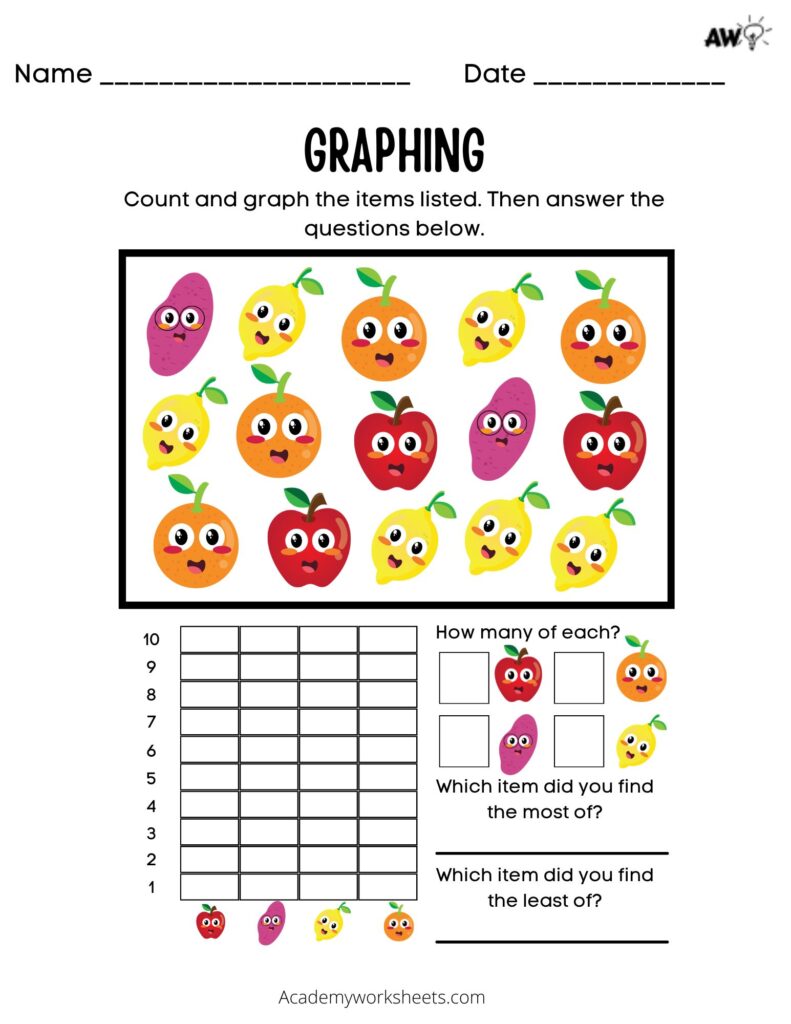
What is a Pictographs Worksheet?
A pictographs worksheet is a chart or graph that uses pictures to represent data in a simple way. It is frequently referred to as a pictogram (or sometimes as a picto). Each picture in the pictogram represents a physical object. They are set out the same way as a bar chart.
Why is a Pictograph Used to Help Teach Math?
A pictograph is used to help teach math because it provides a visual representation of data that is easy to understand and interpret. It is particularly useful for children who are still developing their math skills and may have difficulty understanding numerical or written data. Pictographs can also be used to make math more engaging and fun for students.
How to Teach Math using Pictograph Worksheets?
To teach math using pictograph worksheets, you can use the visual representation of data to help students understand concepts such as data collection, comparison, and analysis. Start by introducing pictographs and explaining the key components such as the picture, key, and labels. Then, provide students with relevant data sets to create their own pictographs. Encourage them to interpret the data and draw conclusions based on the pictograph. You can also incorporate math concepts such as addition, subtraction, and multiplication by using the values in the pictograph. Finally, use variations of pictographs to keep students engaged and challenged.
It has been found that using a fun pictographs worksheet is helpful when teaching children to analyze data. The following are some suggestions for teaching graphing to children.
Here are five ways to make graphing fun for kids:
1. Use colorful charts and graphs: Kids are drawn to bright colors, so consider using colorful charts and graphs to make math more enticing.
2. Incorporate fun themes: Make math more appealing by incorporating fun themes into your lessons. For example, if you’re teaching graphing in the fall, use a pumpkin theme with orange and green bars to represent different data points.
3. Allow for creativity: Encourage kids to get creative with their graphs by letting them choose their own colors and designs. Offer different types of graphs, such as line graphs and pie charts, and let kids choose which they prefer for their specific topic.
4. Use real-world examples: Kids are more interested in math when they can see how it relates to the real world. Use data sets that are relevant to their lives, such as their favorite sports teams or types of candy.
5. Make it a game: Turn graphing into a game by having kids compete to make the most accurate or creative graph. Offer small prizes for winners to create a sense of friendly competition.
Check out Academy Worksheets other Math Worksheets here.